Survey Says: Research Shows Natural, Organic Channel Saw Steady Growth in 2021
This article originally appeared in Presence Marketing’s July 2022 Industry Newsletter.
By Steven Hoffman
Starting out in the natural and organic products industry in the mid 1980s as an associate editor with media and trade show company New Hope Network, there were a few long after-hours sessions spent each summer pouring over completed paper surveys sent in by retailers, and compiling data with company founder Doug Greene to analyze and publish what has since become a milestone marker for the industry, the Natural Foods Merchandiser’s Annual Market Overview Survey.
Photo Credit: Organic Trade Association
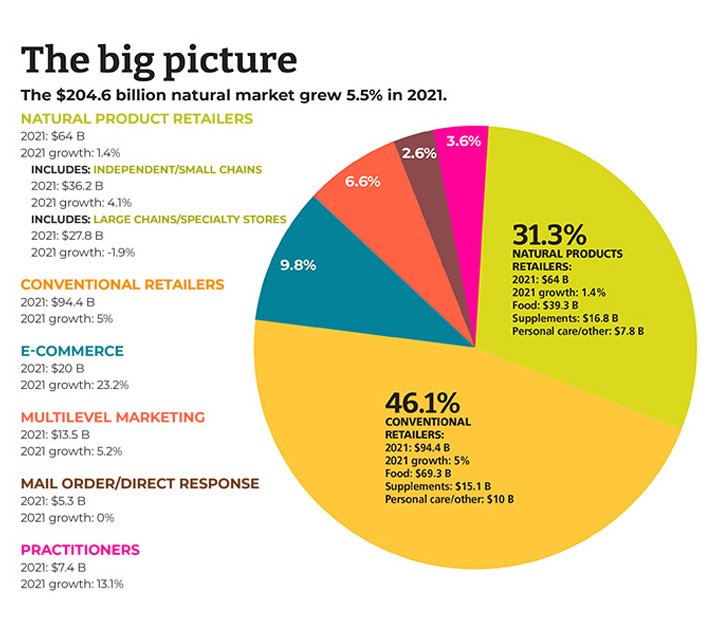
Today, the survey has become much more sophisticated, and so has the market, which has grown 10X since that time to reach $204.6 billion, representing an overall growth rate of 5.5% in 2021, according to this year’s report, published in June 2022.
Once dominated by independent natural products retailers, according to this year’s survey, conventional retailers now command 46.1% of natural products sales, representing growth of 5% in 2021. Combined, independent and large-chain natural products retailers comprised a market share of 31.3% in 2021. However, while independent natural products retailers recorded growth of 4.1%, the large chain and specialty store format saw sales decline by 1.9% in 2021.
Overall, conventional grocers reported natural products sales of $94.4 billion in 2021. Sales were $64 billion among natural products retailers in 2021, comprising independents, small chains and large chain/specialty stores. New Hope estimates there were 21,613 independent and large chain natural channel retail stores in the U.S. in 2021.
Of note, e-commerce sales of natural products continues to grab market share, charting growth of 23.2% in 2021. That’s not surprising, say industry observers, considering consumers were still spending considerable time at home in 2021 during the pandemic. Now, as the world emerges, some of those online consumer shopping behaviors may stick, according to Nutrition Business Journal’s 2022 Supplement Business Report, particularly when it comes to dietary supplement sales. According to NBJ, the supplement industry recorded $59.9 billion in sales in 2021, up from just $43.2 billion five years ago. E-commerce claimed the biggest share of post-pandemic dietary supplements sales growth, reported Rick Polito in the Natural Products Industry Health Monitor.
Photo Credit: Natural Foods Merchandiser 2022 Market Overview Survey, New Hope Network
Across all sales channels, e-commerce “is leading a huge shift in channel dynamics,” according to NBJ Senior Industry Analyst Claire Martin Reynolds. Based on a growth trajectory that is expected to add another $10 billion in dietary supplement sales over the next four years, “2024 is expected to be the record year where e-commerce market share in supplement sales is larger than natural and specialty or mass market retail, coming sooner than previously forecasted given the pandemic-related acceleration,” NBJ reported.
New Hope’s overview also revealed some interesting data regarding the demographic makeup of natural products shoppers.
While a common assumption is that natural channel shoppers are mostly white, well-off moms, that perception is inaccurate, said New Hope’s editors. “In fact, shoppers are fairly evenly divided along gender lines; fewer than half are Caucasian; about 40% are affluent; and more than a third live in households with just two people. Additionally, more than a quarter of natural channel shoppers are Hispanic and more than a third of Asian consumers are significantly more likely to shop at natural grocery stores; 36% of consumers who represent communities of color agree that products at natural retailers were, ‘made with me in mind’ (compared to 32% of all retail customers combined); and Hispanic and Asian consumers specifically are more likely than all natural retail shoppers to agree that they are ‘willing to pay a premium for natural and organic foods and products’ (44% vs. 36%),” New Hope’s researchers reported.
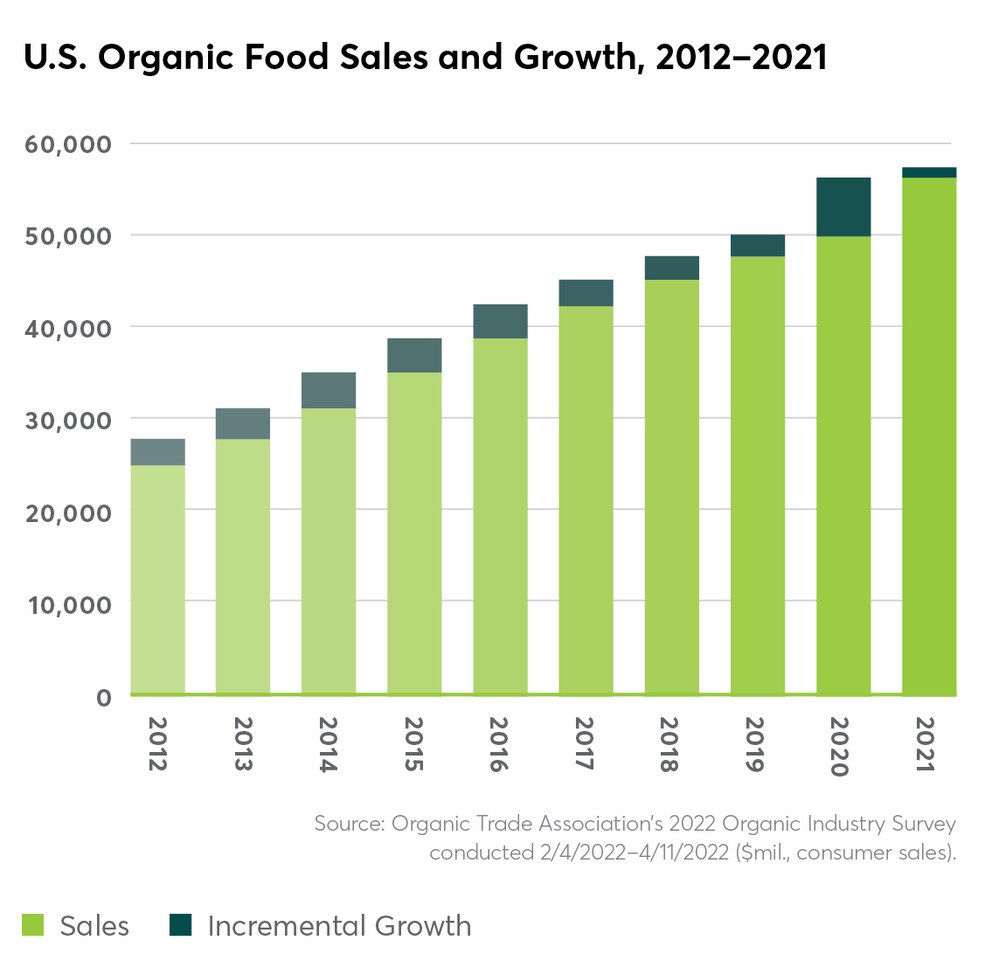
In related news, in its annual Organic Industry Survey, published in June 2022, the Organic Trade Association reported that between 2020 and 2021, sales of organic products surpassed $63 billion, growing 2% during that time period. Food sales, which comprises over 90% of all organic sales, rose 2% to $57.5 billion, and sales of nonfood organic products grew 7% to reach $6 billion in sales.
“Like every other industry, organic has been through many twists and turns over the last few years, but the industry’s resilience and creativity has kept us going strong,” said OTA’s CEO and Executive Director Tom Chapman, “In 2020, organic significantly increased its market foothold as Americans took a closer look at the products in their home and gravitated toward healthier choices. When pandemic purchasing habits and supply shortages began to ease in 2021, we saw the strongest performance from categories that were able to remain flexible, despite the shifting landscape. That ability to adapt and stay responsive to consumer and producer needs is a key part of organic’s continued growth and success.”
Among the strong performers in organic: organic beverages experienced the highest growth (8%) of all major categories, with organic coffee topping 5% growth and $2 billion in annual sales. Organic produce accounted for 15% of the organic products market, bringing in $21 billion in revenue in 2021, a 4.5% increase over 2020. Fresh produce drove growth in that category, at 6%.
While a decline in packaged and prepared organic food sales in 2021 represents a shift away from the pantry loading of 2020, organic baby foods — traditionally a strong entry point for shoppers new to organic — was a bright spot in 2021 with 11% growth. Organic snack foods, which suffered a decline in 2020, saw healthy growth of 6% in 2021, reflecting a return to active lifestyles and demand for healthy, nutritious on-the-go foods.
Among non-food organic products, fiber, supplements and personal care products were the most dominant performers with growth rates of between 5.5% and 8.5% in 2021, said OTA. Textiles, the largest non-food sub-category, represented 40% of the category’s total sales and brought in $2.3 billion in annual sales. Overall, non-food products saw 6% growth in 2021 and represented nearly $6 billion in sales, OTA reported.
However, industry observers caution that the unprecedented inflation the country is experiencing this year could affect sales of typically higher priced organic products as price-sensitive consumers opt for purchasing conventional foods to save money, according to a recent report in the Organic Produce Network. According to an Economist/YouGov poll taken in June 2022, 69% of Americans say changes in the inflation rate have impacted them negatively. In a June 2022 survey conducted by market research firm The Feedback Group, 24% of consumers are substituting similar, less expensive foods and 12% said they are buying fewer organic items and products to cut costs.
“Organic’s ability to retain the market footholds gained during 2020 and continue to grow despite unprecedented challenges and uncertainty is a testament to the strength of our industry and our products. To keep organic strong, the industry will need to continue developing innovative solutions to supply chain weaknesses and prioritizing efforts to engage and educate organic shoppers and businesses,” said OTA’s Tom Chapman.


